
When discussing startup revenue projections, the word “realistic” is constantly brought up. Investors have stated time and time again that they prefer projections that are accurate, practical, and attainable. But it’s a mystery how to calculate a company’s first year’s revenue.
Depending on the business model and maturity of a startup, revenue projections vary. On the one hand, post-revenue startups can make projections based on historical data.
Pre-revenue startups sadly lack this convenience.
So, how should startups start out with their financial projections to suggest a realistic revenue trajectory over time?
We have gathered some of the methodologies and insights to comprehend how to project the first year revenue for a startup through our years of experience in startup fundraising.
Methodology
We examined 102 pitch decks in total from various funding rounds:
- 16 startups seeking pre-seed capital
- 68 startups seeking seed funding
- There are 18 Series-A startups.
In addition to breaking down the data by round, we decided to divide each pitch deck according to the business model.
Here’s an overview of the data:
- 39 B2B technology startups
- 30 B2C tech companies
- 17 D2C startup businesses
- 16 Marketplace startups
Before we discuss the data and findings, it’s important to note that our current database does not have enough data to make any solid analysis of D2C and marketplace business models. As we further dissect this data into rounds, the data set will consequently get smaller. So as usual, we recommend a grain of salt with this one.
Now, to the data.
Overview
By Business Model
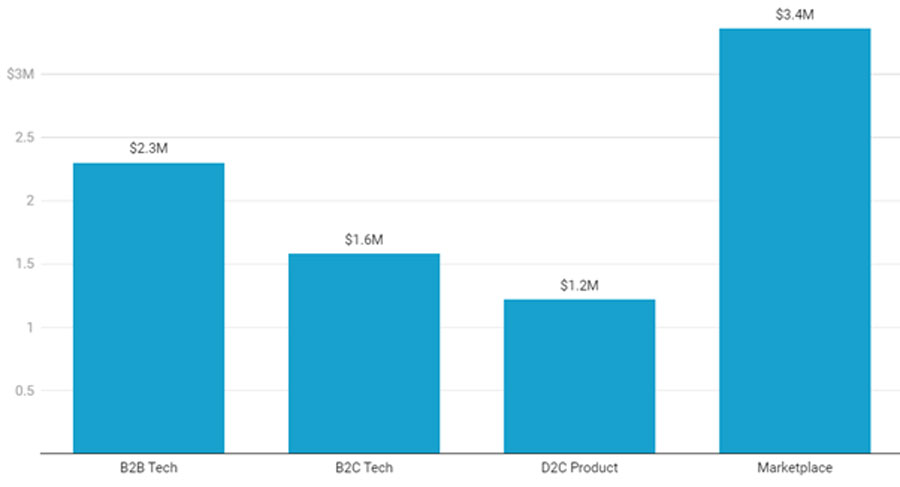
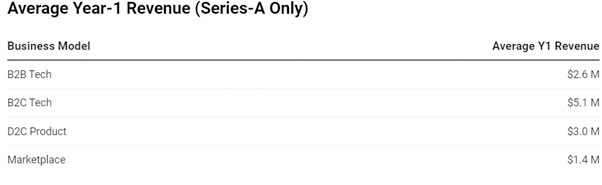
The projection of first-year revenue for startups with various business models is shown in the chart below. Different business models scale up and grow in different ways. Some businesses produce slow and steady growth, while others generate revenue more quickly.
It’s noteworthy that this data set includes startups from various funding rounds. Here, regardless of the stage of maturity each business is in (pre-revenue or post-revenue), we can see how each one scales. We will discuss this in-depth later.
Compared to their competitors, startups in the marketplace anticipate the highest levels of revenue. This is due to the fact that their platform will generate revenue from every transaction, leading to higher overall projections. We don’t have enough information about Marketplace startups to draw any firm conclusions, though.
B2B Tech, on the other hand, is projected to have the second-highest year-one revenue, at an average of $2.3M.
In comparison to other business models, B2B companies have the potential to generate more revenue in a single transaction, which explains why their projections are also so high.
By Round
Let’s examine the revenue projections for startups at various stages of development.
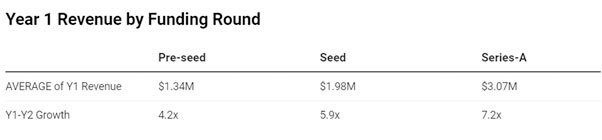
The graph below shows that pre-revenue startups’ projections are a little bit more conservative. However, it isn’t too conservative to make investors think that the opportunity isn’t profitable.
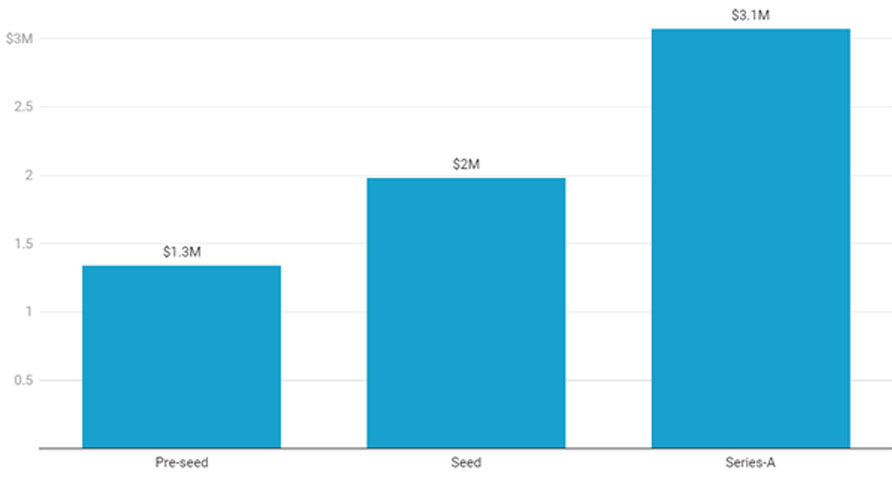
According to our data, seed round startups anticipate bringing in $2 million in revenue for the first year, compared to pre-seed startups’ $1.3 million. Since the majority of pre-revenue startups are still going through development and initial expansion, including R&D and hiring for key positions, this is still regarded as a significant sum of money.
Series-A startups, on the other hand, predict with confidence a $3.1M year-1 revenue because they have already gained some initial traction and other crucial metrics to make reasonable projections.
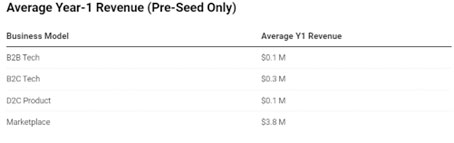
The table below shows that Pre-Seed businesses in the B2B and B2C tech categories have the lowest projected year-one revenues, at less than a million.
Even so, Marketplace startups project a startling $4M in their first year, despite the fact that they are pre-revenue startups. It is obvious that startups in the market make extremely optimistic financial projections.
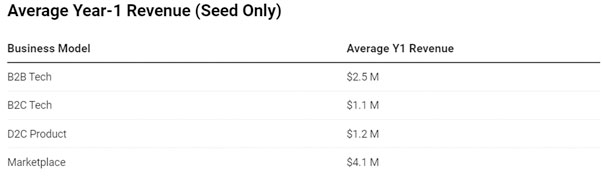
Millions of dollars in revenue are anticipated by slightly mature startups in the seed round. With $1.1M in year-one revenue, startups in the B2C Tech and D2C Products categories have the lowest financial projections.
B2B Tech, on the other hand, had slightly higher year-1 revenue, coming in at $2.5M. Since B2B startups typically generate higher revenue per client, we think this is a result of the nature of their business model.
In the meantime, Marketplace startups continue to project $4M in potential revenue, demonstrating their continued confidence in their ability to increase revenue within a year.
Our post-revenue startup data reveals a striking difference in revenue projections, with Marketplace startups only projecting $1.5M.
As they significantly lower their year-1 projection, this demonstrates that mature Marketplace startups are more influenced by experience and historical data. It is important to keep in mind, though, that the number of startups in our database (n=5) is relatively small.
For Series-A startups, B2C Tech has the highest year-1 revenue projection. Despite having only five participants, they are assuming $5.1 million in revenue.
B2B Tech, with projected revenue of $2.8M, falls in the middle of the spectrum. The most startups in the Series-A round are from B2B Tech (n=9). From the seed round to Series A, there is a slight increase that is noticeable.
The projections of pre-seed and seed startups, also referred to as “pre-revenue startups,” are more conservative.
This is due to the lack of specific metrics—such as customer or revenue metrics, for instance—on which they can currently base their financial projections. Consequently, they would undoubtedly have a lower revenue projection than Series-A.
As they would have the necessary metrics at this stage, Series-A startups have an advantage over others when making projections.
From B2B Tech onward, it is clear that there are very high expectations for the first year of their startup.
Due to the frequently small teams at these startups, this is especially intriguing for B2C tech business models.
Although the sample sizes for the D2C product and marketplace were quite small for this study, their projections were still sufficiently high to warrant attention.
Out of all business models, B2C tech is expected to grow at the fastest rate. According to their revenue projection, this is exactly what happened.
Conclusion
Given the information they may or may not have, pre-revenue startups predict revenue more conservatively than post-revenue startups.
Overall, this study shows that, when compared to other business models, B2B Tech has the lowest and, arguably, most realistic year-one revenue.
A “realistic” first-year revenue forecast still depends on the startup’s funding round and business model. However, it’s critical to keep in mind that the projection for the first year should also dictate the projections for the following year.
We advise using a marker of 2x annually because it will demonstrate significant growth without appearing irrational to investors.